Sea temperature sensors
How the sea sensor works
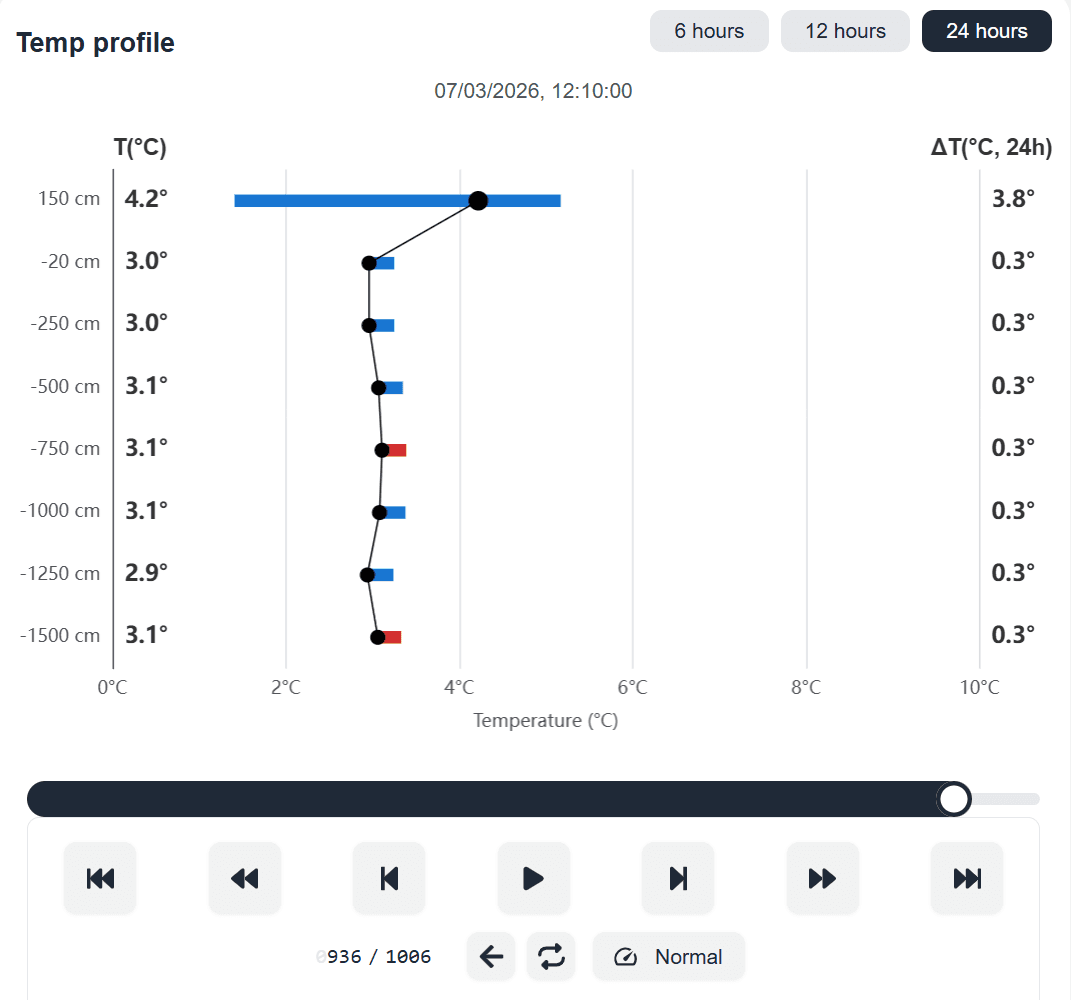
Our sea sensor works on the same principle as SM4: a cable with temperature sensors along its length. It reaches 15 m deep, with a sensor every 2.5 m, plus one at the surface for air temperature. Readings are published on snowsense.is, so fish farms can follow sea temperature at every depth.
See live sea data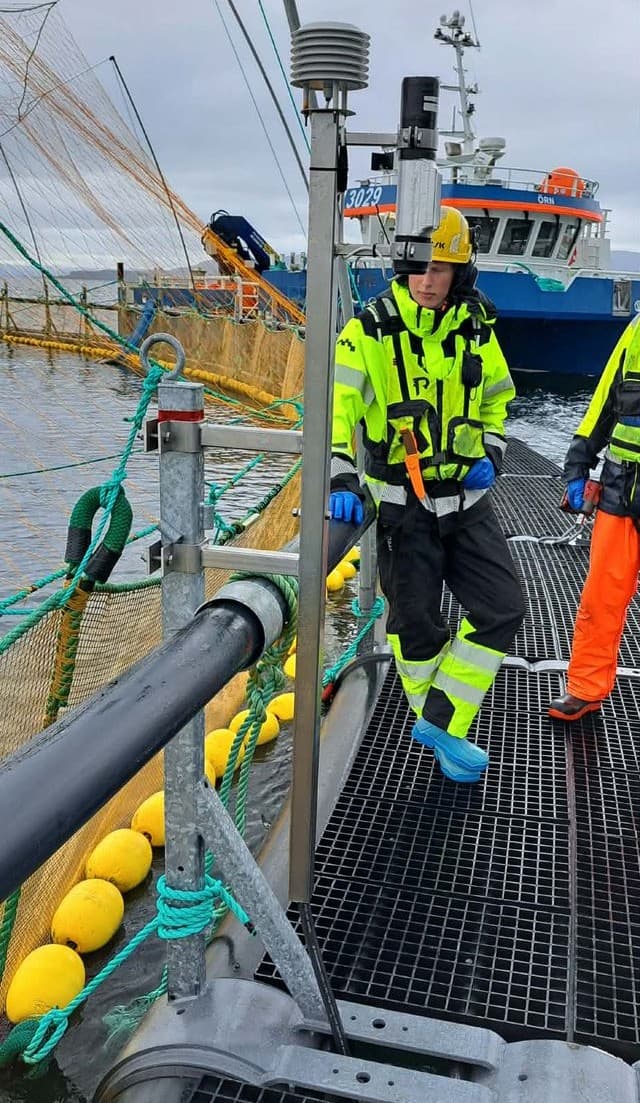
Reading the sea sensor chart
The chart below shows the latest readings. Depth is on the vertical axis, from the air sensor above the surface down to the deepest sensor at 15 m. T (°C) is the current temperature at each sensor, and ΔT is how much it has changed over the selected period of 6, 12 or 24 hours. Red bars mean the temperature has risen, blue bars mean it has dropped. Drag the slider to go back in time.